
Astronomy for Change is pleased to showcase a brand-new addition to Insight Observatory‘s worldwide telescope network. As previously mentioned, their remotely accessible telescope network spans five continents, including Africa and Australia.
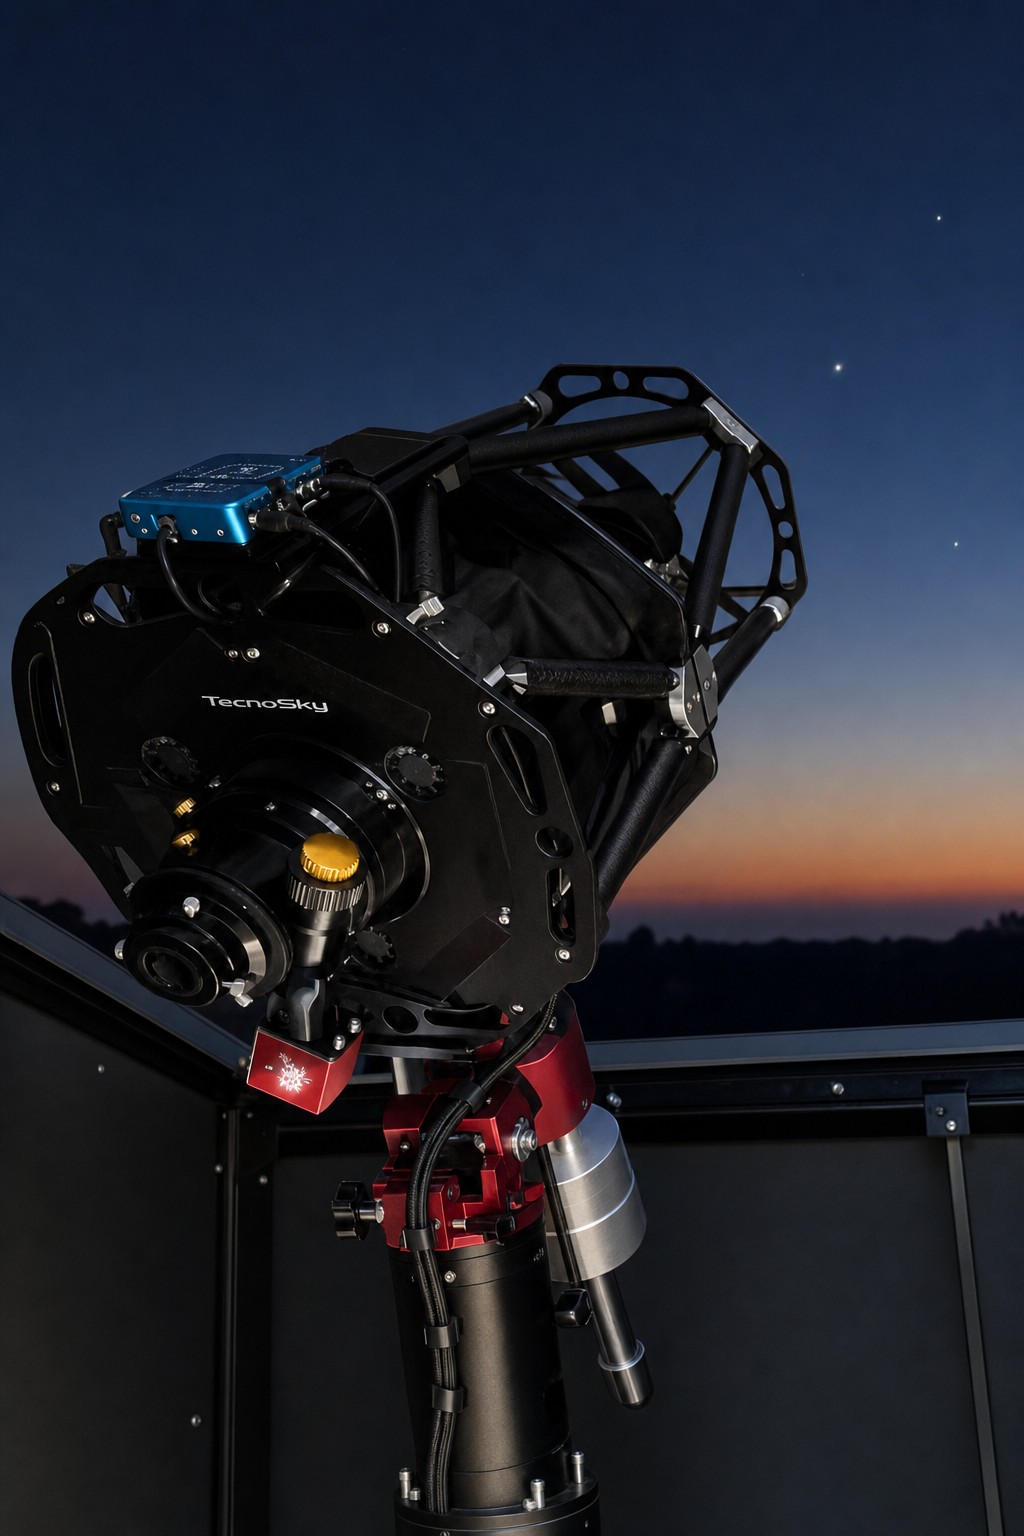
Insight Observatory’s new, 0.25 meter F/6.6 Deep-Space RC Reflector. Location: Hakos, Namibia, Image credit: MP, Insight Observatory.
Located in the southern hemisphere, under the pitch-black skies of Hakos, Namibia, the new addition is a 0.25 meter (10″) advanced, research-class deep-space reflector of the Ritchey–Chrétien design, an optical design often used in large, observatory-class telescopes operated by governments or universities. The design provides error-free, diffraction-limited resolution across a wide-field of view.
“Diffraction Limited” is an optical term used to describe the resolving power and performance of a given telescope: there are no measurable optical defects and the only thing limiting the telescope’s performance is its physical size (the ability of any optical instrument to resolve and discern fine detail is limited only by its physical diameter).
To highlight the instrument’s superlative performance, we present the spectacular globular star cluster Omega Centauri (NGC-5139) below.
In order to understand the significance and importance of this addition, it is necessary to point out that any observer is restricted to what they can observe simply by their geographical location. If you live in the Northern Hemisphere, much of the southern Milky Way and the spectacular jewels of the southern sky are inaccessible. Likewise, for our friends in the southern hemisphere, the opposite is true for northern hemisphere skies.
By incorporating these southern hemisphere additions in their network (Namibia, southern Africa and Australia), Insight Observatory has solved this problem and opened up the spender of the southern sky to observers everywhere. In fact, this new addition opens up the southern sky to the world!
For less than the price of a movie for two, you can access these world-class instruments and begin your own journey of discovery! If it all seems too daunting, please feel free to contact the author here.
Omega Centauri

Over 22,200 stars are visible in this image of Omega Centauri acquired and processed by the author using Insight Observatory’s 0.25 meter (10″) Deep Space Astrograph located in Namibia.
Omega Centauri (ω Cen, New General Catalog 5139) is a globular cluster in the constellation Centaurus. It’s so bright that it is included as a point in the constellation with the designation Omega (ω) and first identified as a non-stellar object by Edmond Halley in 1677. Located 17,090 light-years distant, it is the largest known globular cluster in the Milky Way with a physical diameter of roughly 150 light-years. It is estimated to contain approximately 10 million stars, with a total mass of ~4 million solar masses thus, adding to it, the distinction of being the most massive known globular cluster in the Milky Way.
This cluster is best observed from locations below the equator. For observers in the Northern Hemisphere above latitude 40 N, it never rises.
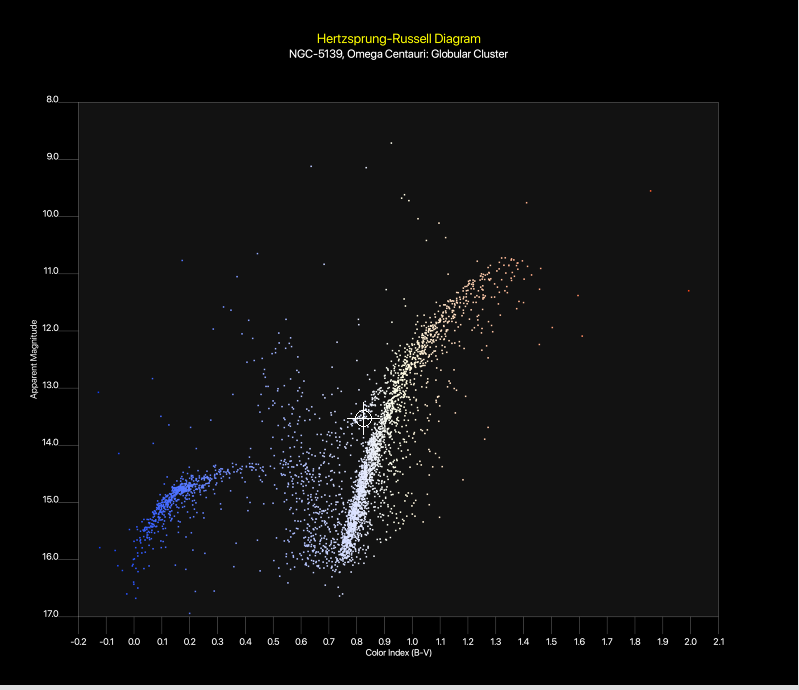
We’ve published a number of articles highlighting our use of a third-party HR Diagram plotter in the post imaging processing software suite PixInsight, and now present an evolutionary HR Diagram of of Omega Centauri using this image.
Multiple evolutionary tracks are evident in the diagram with numerous studies attributing the mass and size of Omega Centauri to it’s acquisition of other stellar populations and perhaps as the surviving nucleus of an ancient dwarf galaxy, captured and disrupted several billion years ago by the gravitational field of the Milky Way Galaxy.
In its essence, the Hertzprug-Russell diagram is an evolutionary diagram. The magnitude or luminosity of the stars is plotted along the vertical axis while the temperature is represented by the “Color Index” and plotted along the horizontal axis. To get an experiential sense of what this means, the sun has a color index of ~0.65 (see the horizontal axis below).
All stars represented in this diagram have evolved off he main sequence and are producing carbon and oxygen in various stages of helium burning. Main sequence stars in the image appear as the faintest stars visible.
The Gaia data necessary to correlate the stars in the image with their position, distance, temperature and color is limited to ~magnitude 20 – 21. That’s where the cluster’s main sequence population would begin for Omega Centauri. Thus, there are no main sequence stars represented in this diagram. All stars are correctly placed as evolved, helium-burning sub-giants, orange and red giants, hot (blue) horizontal-branch stars and asymptotic branch stars.
Briefly, the diagram can be understood as follows:
1) Main sequence stars begin at about magnitude 20 and are thus not visible in this diagram.
2) Sub-Giant Branch (SGB) stars begin at about magnitude 15 and merge with the orange and reg giants at about magnitude 14
3) Red Giant Branch (RGB) stars are clearly seen extending up and to the right from about magnitude 14 to the end of the arc
4) Asymptotic Giant Branch (AGB) stars appear as a secondary stream, just above magnitude 14 and appear to merge with the RGB stars at that point.
5) Horizontal Branch (HB) stars appear blue, on the left side of the chart between magnitude 14.5 through 16 appearing as a curved arc centered at about magnitude 15
6) Blue stragglers are centrally located within the cluster with a color-index of ~0.65 between the HB stars and the SGB stars. Because of the high mass density in the central region, many evolved stars have extended lives after forming a parasitic binary with another star, drawing fresh hydrogen fuel off that star. These Blue Stragglers had already begun their helium-burning cycle internally prior to the merger and are thus already very hot, hence their blue -> blue-white appearance.
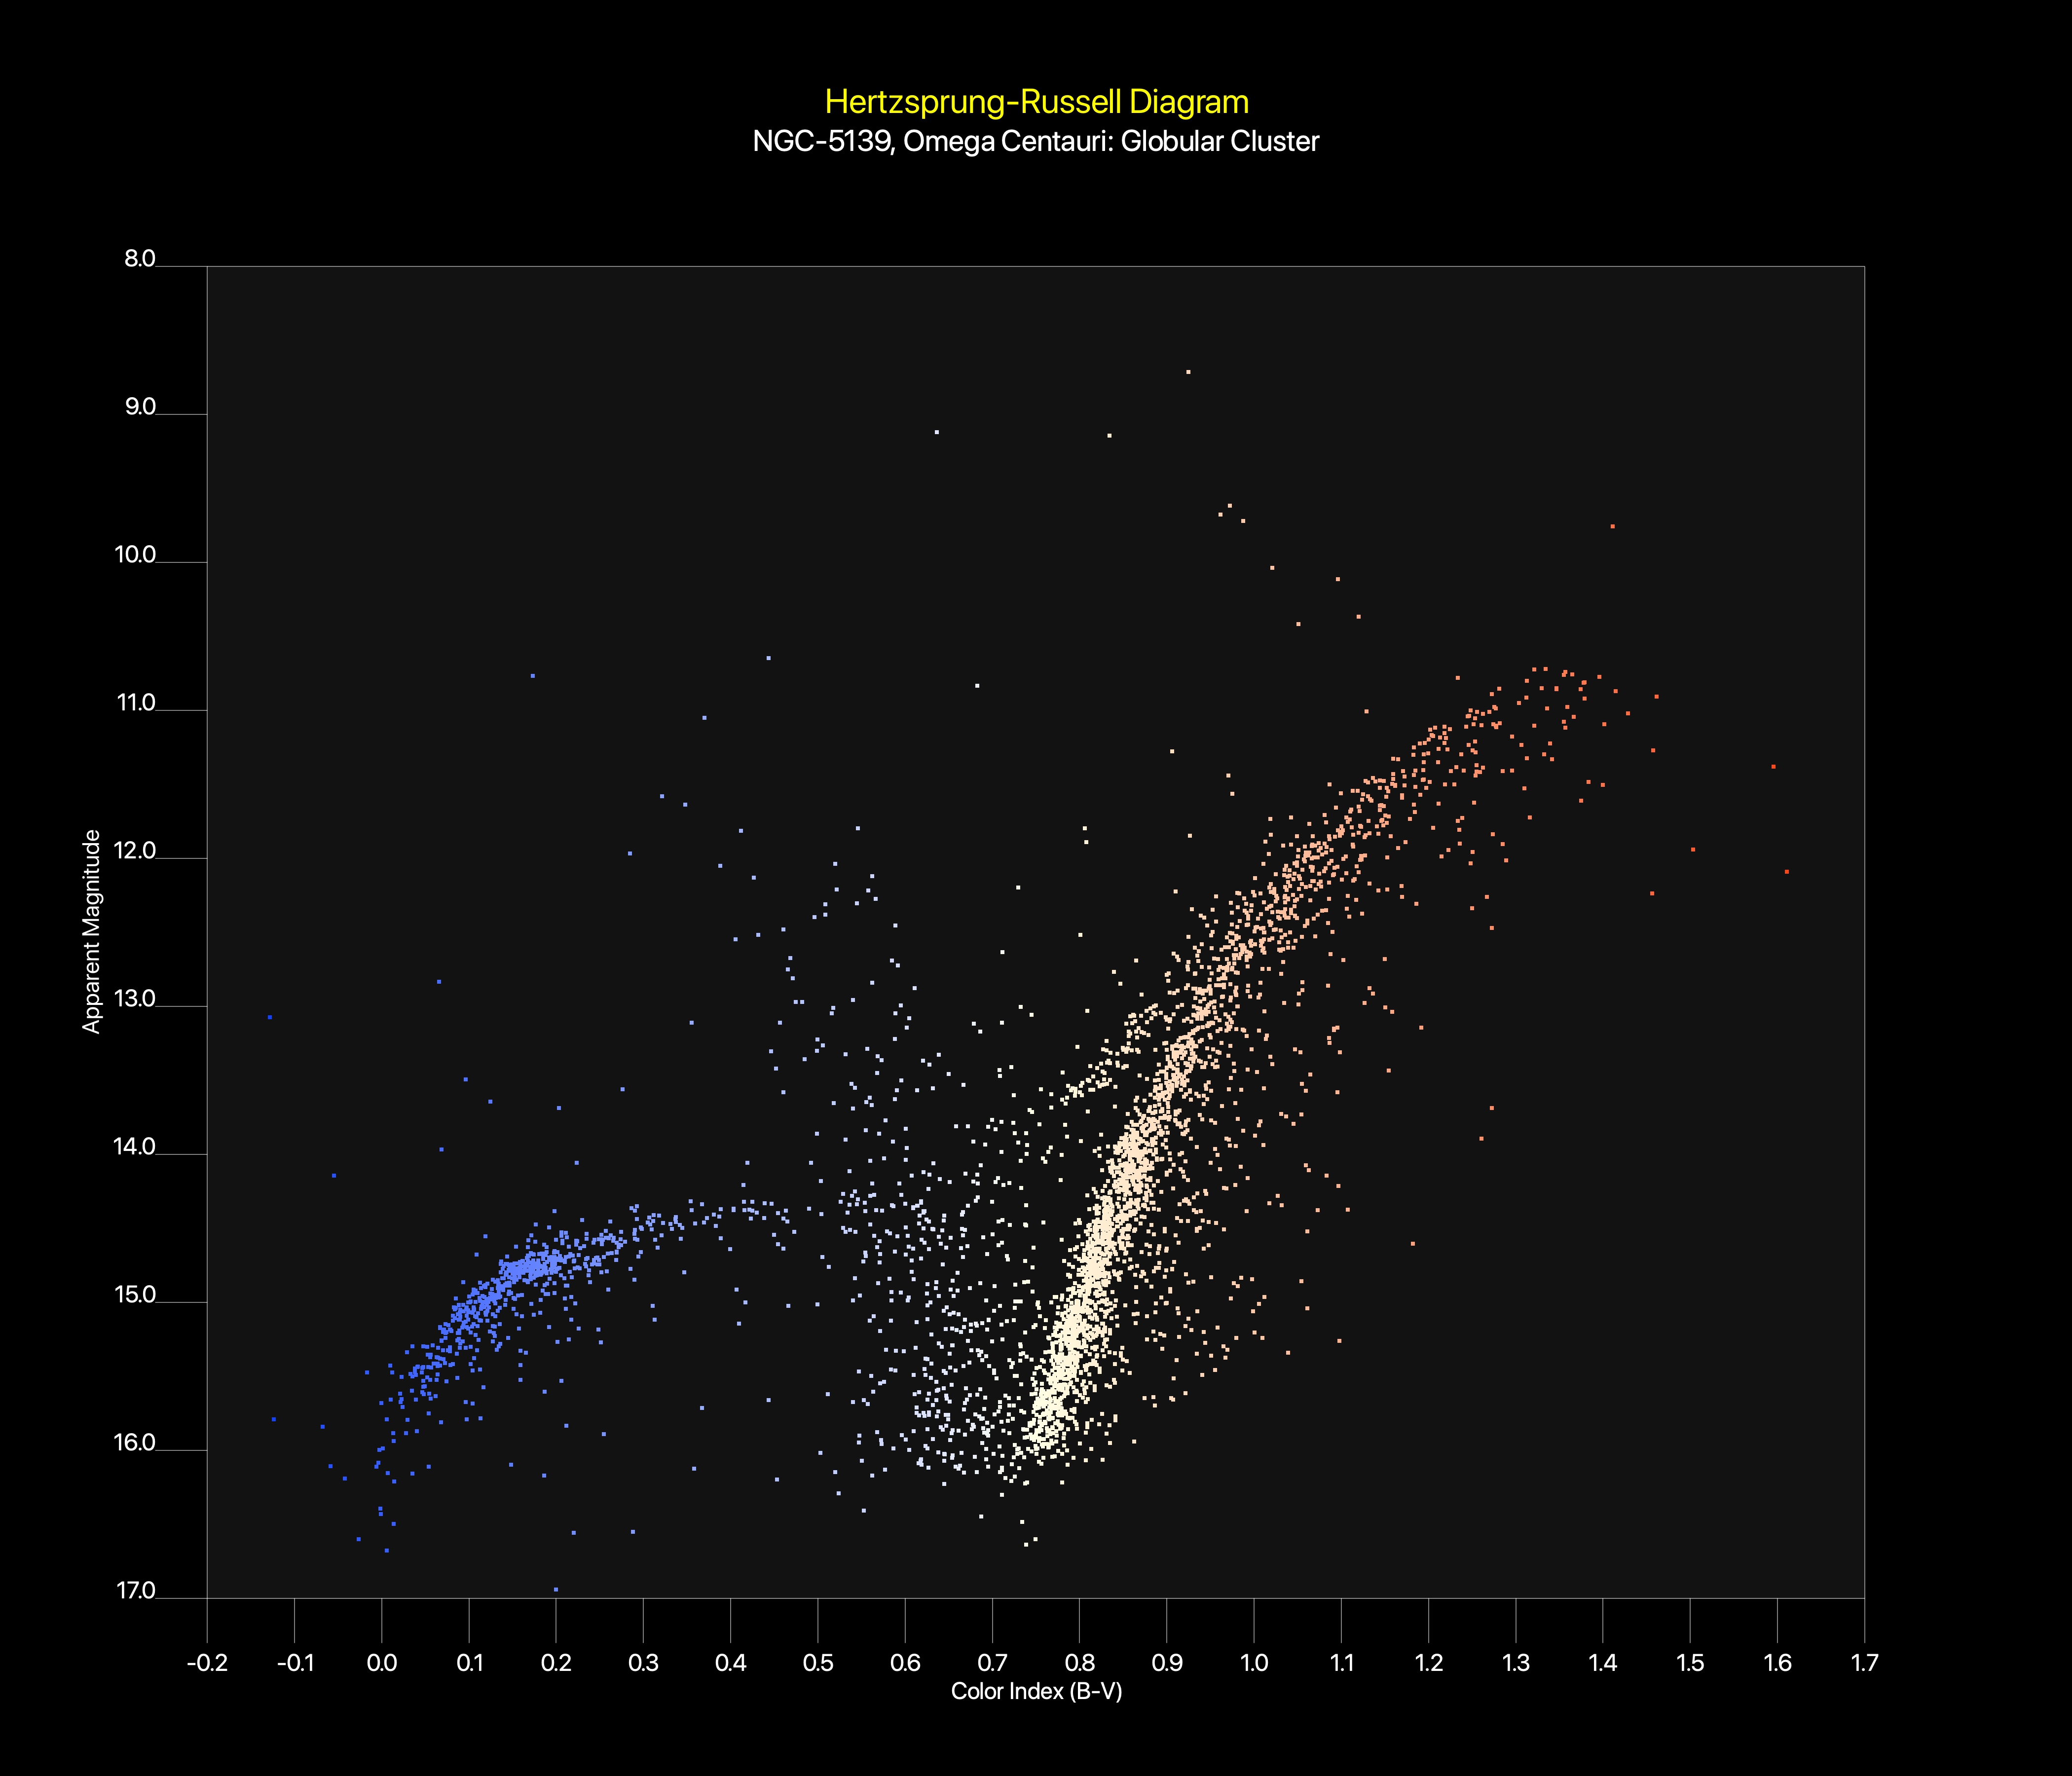
3,700 stars out of 22,200 in the original image are represented in this Hertzprung-Russell Evolutionary diagram of the Globular Cluster Omega Centauri (NGC-5139). Image credit: Astronomy for Change and the author via PixInsight.
3,700 stars are plotted in the diagram out of over 22,200 stars contained in the image.
To summarize the major stellar populations and their evolution:
1). Main sequence stars such as our sun are producing energy through nuclear fusion reactions in their cores. In this process, 4 hydrogen nuclei are fused together to produce one helium nucleus and energy in the form of gamma rays. This is the process that powers all stars on the Main Sequence.
2). Sub-Giant Branch stars have permanently left the main sequence after exhausting all but 12% of their compliment of core hydrogen (for 1 solar-mass stars). They begin to expand and change internally, dynamically responding to internal structural changes as the inert helium core contracts and hydrogen burning shifts to a shell surrounding the core.
3). Red Giant Branch stars have exhausted their core hydrogen, although considerable hydrogen remains in their outer layers. They produce energy through hydrogen-shell burning around an inert, gradually growing helium core. After helium ignition, the star begins core helium burning, producing carbon and oxygen. In stars with initial masses below about 8 solar masses, the resulting inert carbon–oxygen core will eventually become a carbon–oxygen white dwarf.
4). Asymptotic Giant Branch stars are highly-evolved in the 0.5 to 8 solar mass range, beyond the red giant stage and on their way to their end state as Planetary Nebulae.
5). Horizontal Branch stars are low-mass stars that have left the red giant branch after igniting helium in their cores. While hydrogen continues to burn in a surrounding shell, they produce energy through core helium burning via the Triple-Alpha Process, synthesizing carbon and oxygen from a 2-stage helium-beryllium cycle. Many horizontal branch stars appear blue and are very hot, although their temperatures and colors can vary depending largely on the mass of their outer hydrogen envelopes.
For added value and a great educational aspect to the plotter is the ability to select one of the data points in the diagram with the corresponding star then automatically selected in the source image.
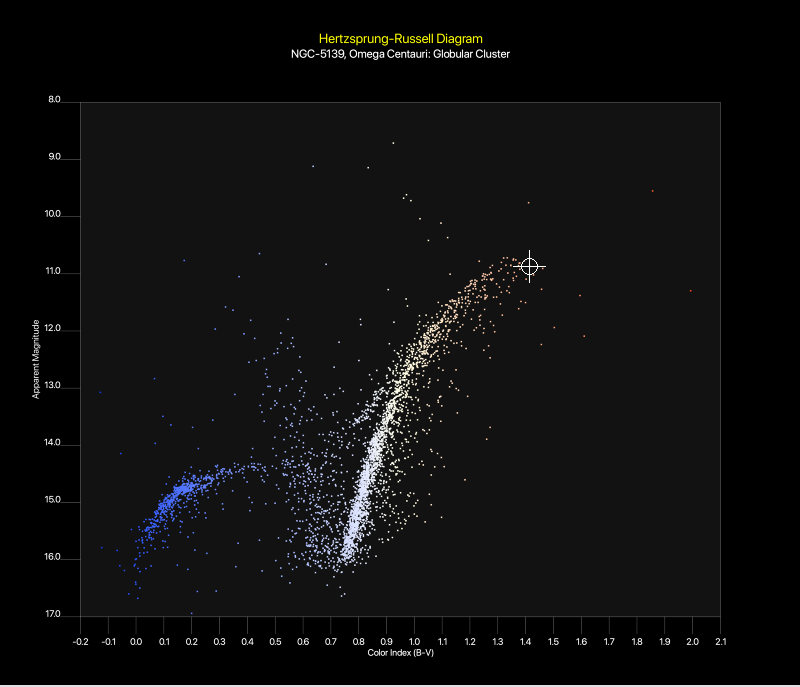 Location of the selected star in the RGB | 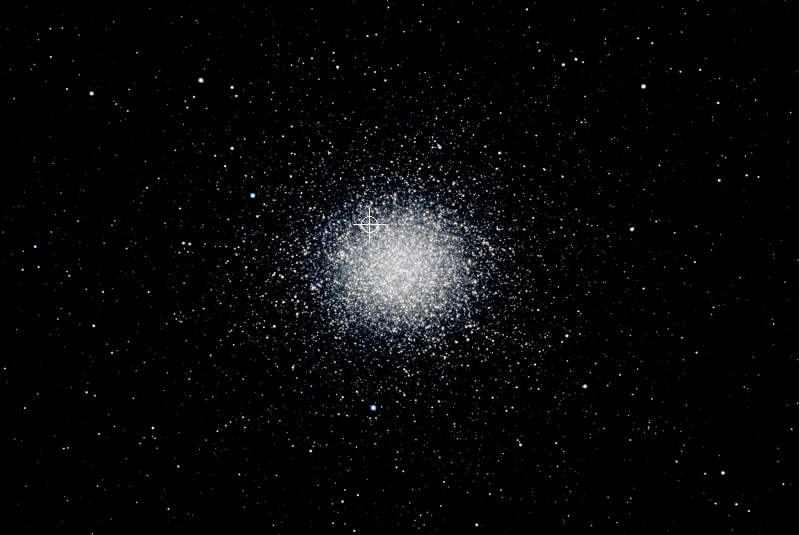 Location of the star represented in the HR Diagram to the left |
 Location of the selected star in the AGB | 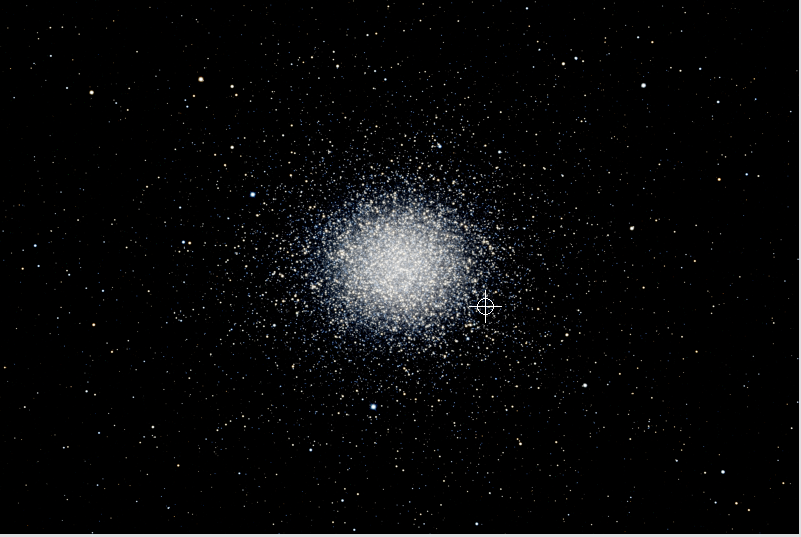 Location of the star represented in the HR Diagram to the left |
More to come from Astronomy for Change and Insight Observatory!
Astronomy for Change is an AI Free Zone

From Las Cumbres Observatory, a quick, interactive web-based view of the sky at the moment, complete with interactive controls The Sky Now. The page includes “The Sky Tonight”, a quick, interactive web-based version of Stellarium.
Astronomy For Change: https://astronomyforchange.org
Did you enjoy this article or like what we do? Why not leave a tip or buy us a Coffee?
Follow Us On Twitter: https://twitter.com/astronomychange
Why not support us on Patreon: https://www.patreon.com/astronomyforchange
Imagination is more important than knowledge

An index of all articles can be found here.
Comment Moderation Policy
If you enjoyed this article, please consider supporting us with a modest donation
or through a subscription on our Patreon Page
Membership at Astronomy for Change is Free!


One thought on “Spectacular Southern Sky Summer Splendor With Insight Observatory!”