
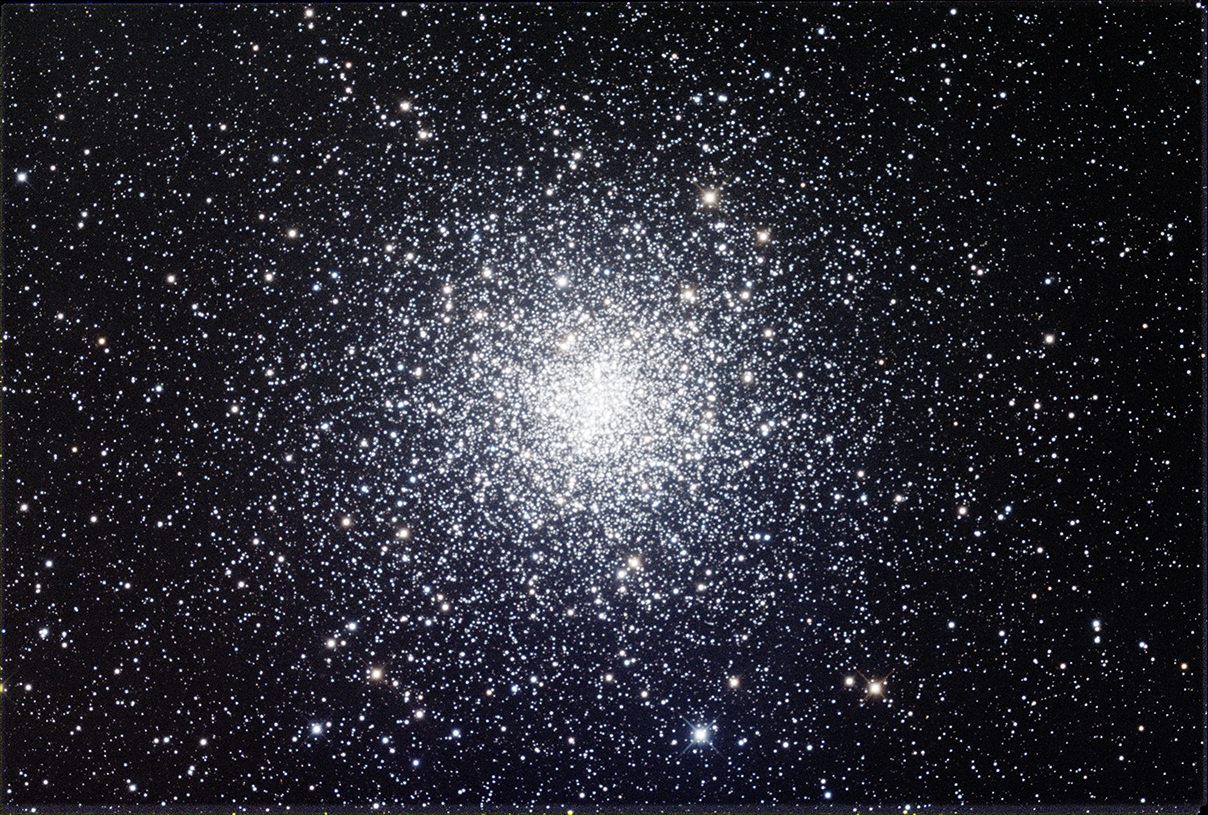
Low resolution image of Messier-4 as imaged by the author with Insight Observatory’s 0.41 meter remote telescope, Rio Hertado Valley, Chile. At only 7K light years distant, stars fainter than magnitude 18 are visible.
We continue our discussion of the Seasonal Celestial Jewels of the Summer Sky and present full resolution images of these spectacular Globular Clusters and their respective HR Diagrams in the Download section.
As described in our introductory post, where we announce our new collaboration with Insight Observatory and their Starbase portal, we describe a third-party tool that has been developed for PixInsight to read an image, reference and match the stars in the image with the Gaia database (see below) and, in the process, produce an HR Diagram on your computer desktop!
| Messier-4 | Messier-22 |
|---|---|
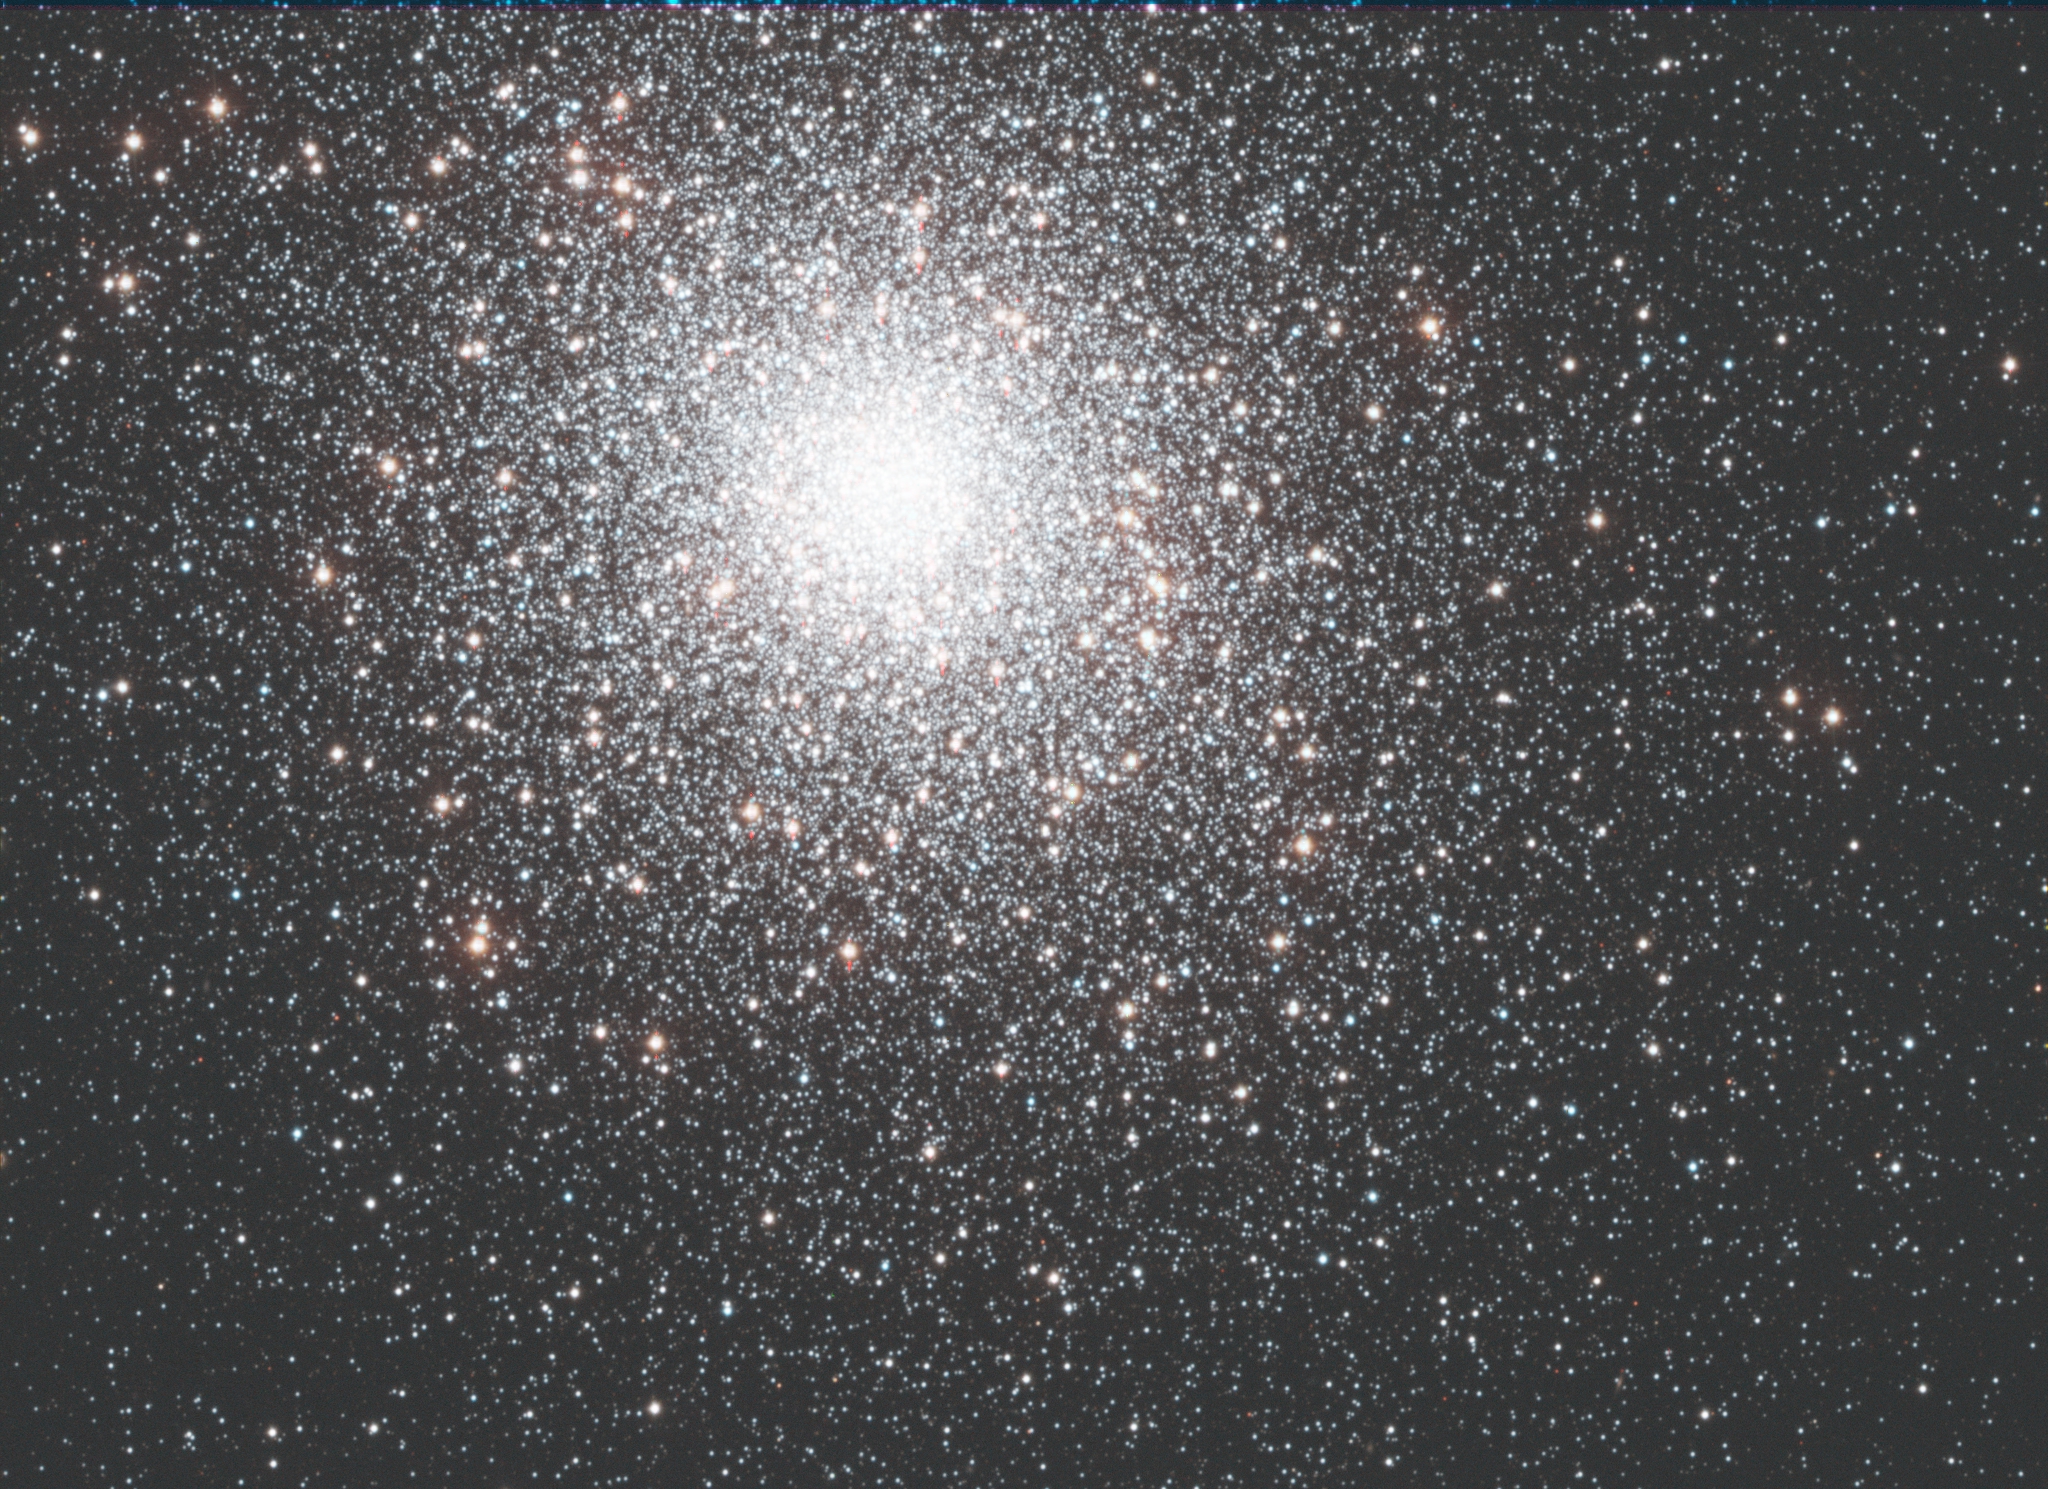
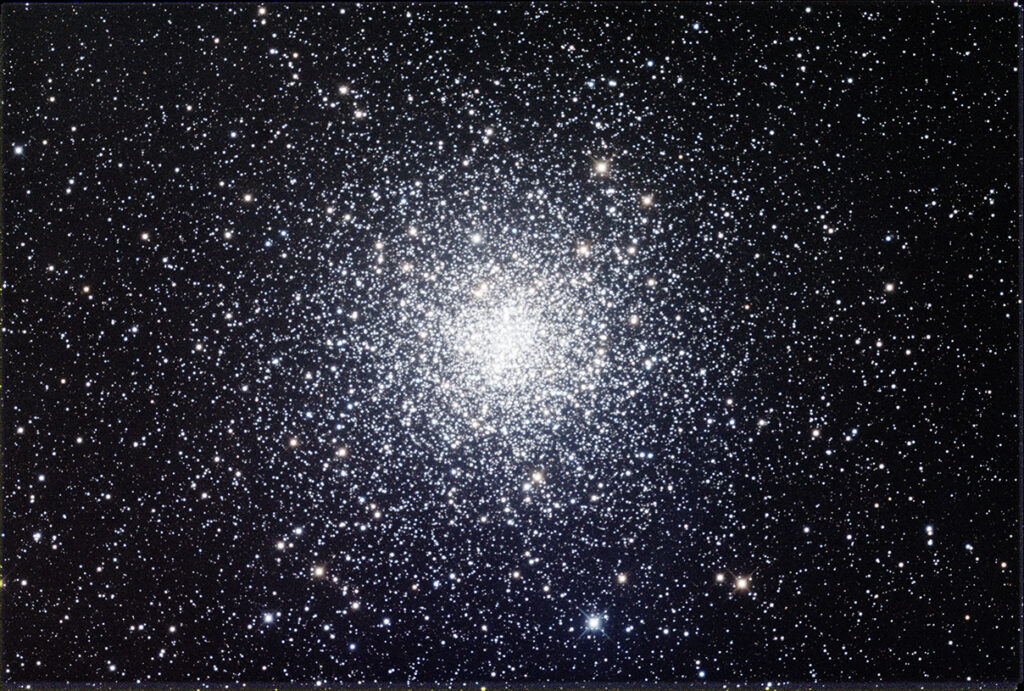 960 second (16 minute) exposure of Messier-4 as imaged with Insight Observatory’s 0.40 meter (16″) RC Deep Space Reflector in Chile’s Rio Hertado Valley. Stars fainter than magnitude 18 are visible. This object appears larger than M-22 since it’s 3,000 light years closer at ~7,000 LY distant. | 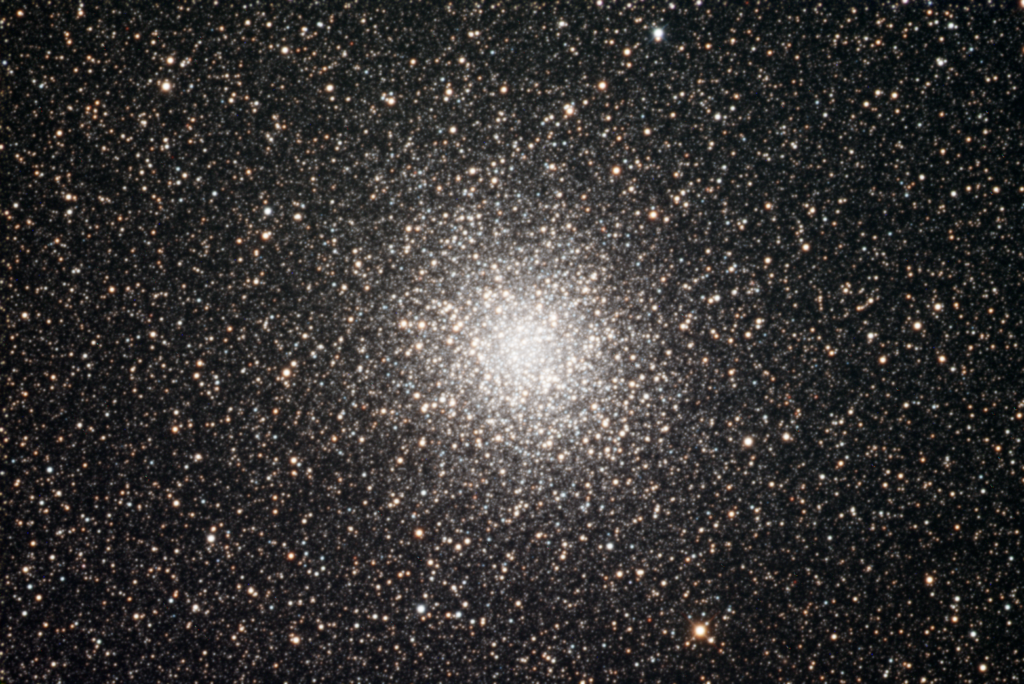 960 second (16 minute) exposure of Messier-22 as imaged with Insight Observatory’s 0.40 meter (16″) RC Deep Space Reflector at Pie Town, New Mexico. Stars fainter than magnitude 16 can be seen. Compared to other globular clusters, such as the famous Messier-13, Messier-22 is relatively close at ~10 KLy. |
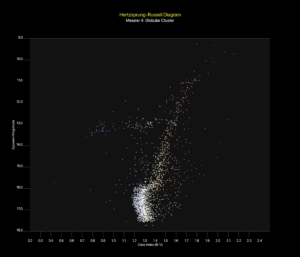 HR (Color-Magnitude) diagram of Messier-4 with its stars represented at its standard distance from us. Apparent magnitude is represented along the vertical axis, with the sun barely visible at magnitude 16.5 at the cluster’s distance of ~7 KLy. Since all stars are at the same distance, the relative brightness of the stars, one to another, is accurate. The cluster’s Horizontal Branch (HB) stars are represented by the horizontal band of blue / blue-white stars just above the mid-section to the left at an average apparent magnitude of 13. | 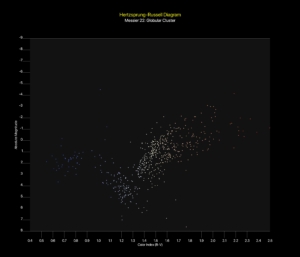 HR (Color-Magnitude) diagram of Messier-22 with its stars represated at 10 parsecs. Absolute magnitude is represented along the vertical axis. With an absolute magnitude of 4.8, the sun is barely visible at the cluster’s distance of 10 KLy. The sun’s color index is approx 1.05, so that would place it in the lower 1/3 of the diagram. Absolute magnitude is a star’s apparent magnitude measured at a distance of 10 parsecs or 32.6 light years. Multiple evolutionary tracks from multiple stellar populations are evident in this diagram. |
Note: both image sets here are available for full resolution download below. The low-resolution versions presented here are for illustration purposes only. Also note that in these previews, one example each of a cluster’s HR Diagram is presented, one at its standard distance from us, the observer and the other at 10 parsecs (32.6 Ly). Both are available for each of the clusters in the download section below.
As described in that post, that third party tool has been modified by this author to run on older versions of macOS and PixInsight. As promised, fully detailed results from the HRD Plotter tool are presented in this post. As described previously, PixInsight is a post imaging processing suite for Astronomers and Astrophotographers.
The Hertzsprung–Russell Diagram
The Hertzsprung–Russell diagram, at its core, is the essence of stellar astronomy and is considered by many to be its Holy Grail.
Developed independently by Ejnar Hertzsprung in 1911 and Henry Norris Russell in 1913, it represented a major step in our understanding of stellar evolution or how stars form, evolve, live out their lives and ultimately what happens to them at the end of their lives.
By mapping temperature, color and luminosity, it acts as the master key to understanding the lifecycle, mass, and evolution of every star in the universe. Abbreviated as the “H-R Diagram”, the Hertzsprung-Russell Diagram plots the stars’ absolute magnitude or their intrinsic power (luminosity) on the vertical axis and their color temperature on the horizontal axis. In doing this, we can more fully understand -and visualize- the relationship between their temperature, luminosity, and color. It is also referred to as a color magnitude diagram or CMD with the ‘Color Index‘ along the horizontal axis and the Luminosity (intrinsic power) along the vertical axis.
The factors that determine a star’s luminosity are its effective temperature and physical radius. A large star with a cooler relative temperature can radiate the same amount of energy as a smaller star with a higher effective temperature simply because there’s more surface area. The “color temperature” is the “color” that corresponds to the star’s photospheric temperature (note: the photosphere of any star is the outer limit to its physical ‘disk’ and is not a ‘solid’ surface).
The higher the temperature, the shorter or more “blue” the wavelength emitted. The lower the temperature, the longer or more red the wavelength emitted.The luminosity (the power produced or energy per second per unit area) is very sensitive to temperature. In fact, it varies as the 4th power of the temperature! If you were to compare two stars, one twice as hot as the other, the hotter star would radiate 16x the power relative to the cooler star! For example, the star Sirius, the brightest star in our sky, has an effective photospheric (surface) temperature of ~ 10,000 K whereas the sun has an effective temperature of 5,780 (Kelvin). Their physical radii not withstanding, Sirius is ~ 10x as luminous as the sun. The ratio of their respective temperatures to the 4th power is approximately 10. All of this factors into the dynamics of the HR Diagram.
Abbreviated as the H–R diagram, or HRD, it is a scatter plot of stars showing the relationship between the stars’ absolute magnitude or luminosity on the vertical axis and their stellar classifications or effective temperatures on the horizontal axis.
| HR Diagram Produced from a Sampling of 22,000 stars Plotted from Hipparcos | HR Diagram Produced from a Sampling of over 4 Million stars Plotted from ESA’s Gaia Mission |
|---|---|
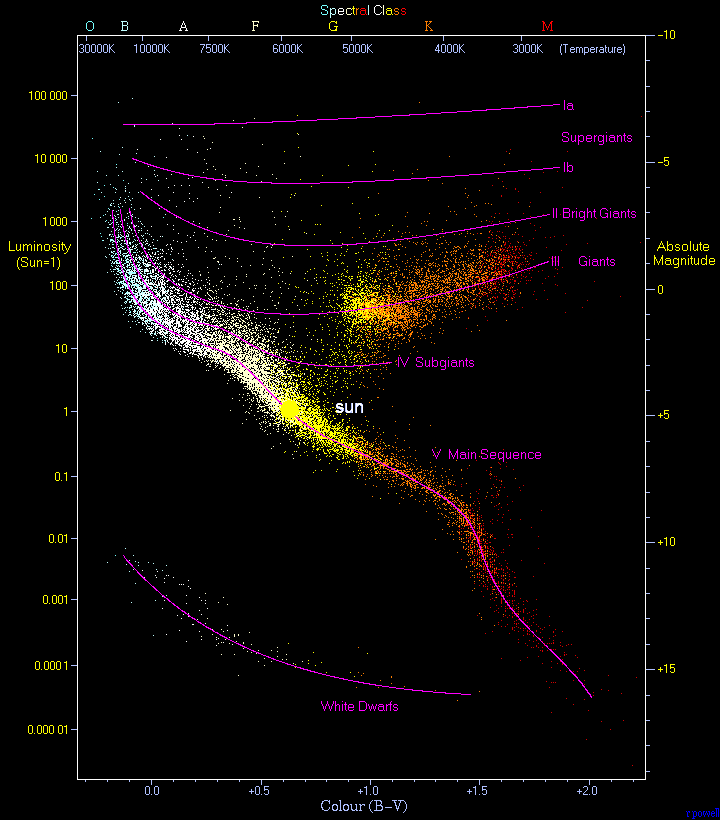 With the sun placed at its correct relative position, this is a Hertzsprung-Russell diagram with 22,000 stars plotted from the Hipparcos Mission Catalogue and 1,000 stars from the Gliese Catalogue of nearby stars | 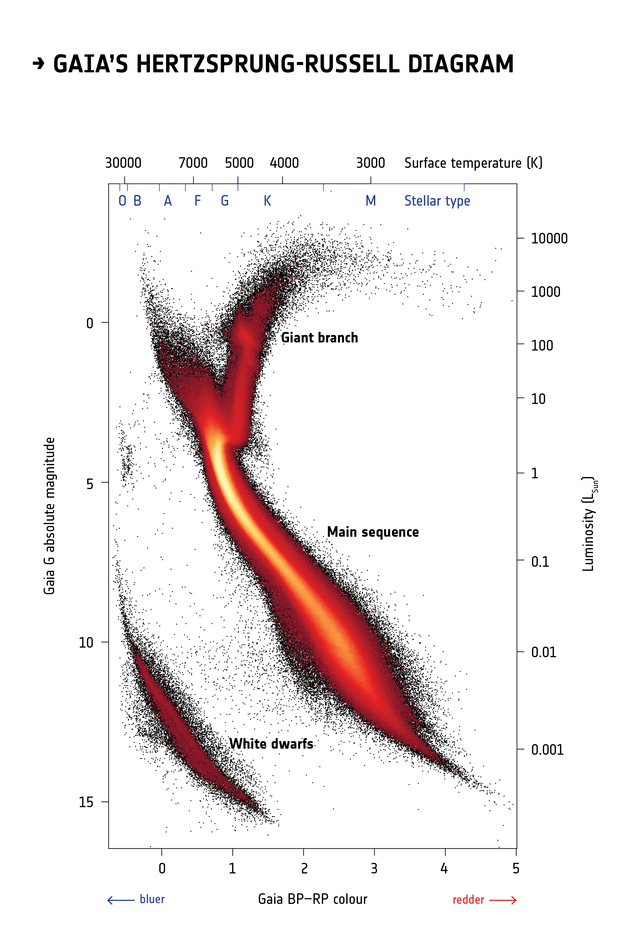 More than four million stars within five thousand light-years from the Sun are plotted on this diagram using information about their brightness, color, and distance from the second data release from ESA’s Gaia satellite. It is known as a Hertzsprung-Russell diagram after the astronomers who devised it in the early 20th century, and it is a fundamental tool to study populations of stars and their evolution. Note: this same Gaia data is actively used as essential input to PixInsight’s HR Plotter and thus, to produce the HR Plots featured in this article. |
Globular Clusters
Globular star clusters are vast and diverse agglomerations between 50,000 to 500,000 stars, all gravitational bound to each other, containing some of the oldest stars in the universe, some of them relics dating back to the dawn of time, 13.7 billion years ago. They technically reside outside the confines of the galaxy, in a region known as the “Galactic Halo”.
Stellar Evolution of Globular Clusters and Evolutionary Tracks
A lingering question is: how does their membership in a globular cluster effect the evolution of individual stars and stellar populations generally?
Some insight can be gained by studying the HR Diagrams of these clusters. For staters, without exception, is the discovery of a population of stars known as “Blue Stragglers“. They are evolved stars that have acquired a companion, no doubt a result of the high mass-density at the cluster’s center (it’s very crowded in there!). Blue stragglers are unusually hot, luminous main-sequence stars found above and shifted to the blue-end of a stellar population’s main-sequence turnoff point (the point on the HR Diagram where any star leaves the Main Sequence). They appear younger and more massive than surrounding stars, most likely because they gained mass through a stellar merger or mass transfer from a binary companion.
Globular Clusters contain stars on at least five distinct evolutionary tracks: Main sequence stars (stars such as our sun), Sub-Giants, Red Giants (stars such as Arcturus), Asymptotic Branch and Horizontal Branch stars (the term “branch” refers to their evolutionary “track” on the Hertzsprung-Russell (HR) Diagram – see examples on this page, including the plotted images. And it is these 5 evolutionary tracks that can be studied using the HR Plotting tool available in PixInsight, each a unique opportunity to gain new insight into the evolution of these enigmatic objects and stellar evolution in general.
Stellar Evolution as Individual Stars and as a group
These clusers contain over 100,000 stars in many cases, date back to the dawn of time with multiple stellar populations and evolutionary tracks. This provides a grand opportunity to test and study our models of stellar evolution for stars, as individual compoents in their own right and their evoultion as a group and if or how that effects the dynamics of their evolution.
An Important Lesson
An important lesson in stellar luminosity can be learned from studying globular clusters.
Globular clusters are ancient relics, composed of stars dating back to the earliest epochs on the cosmological timeline. Arcturus, one of the five brightest stars in the sky and the principal star in Bootes the Herdsman, beckons red-orange, warm, bright and friendly in our sky. It is a mere 37 light years distant. It is stars such as Arcturus, the evolved red-giants, that are some of the more luminous stars that populate globular clusters such as Messier-4 or Messier-22. It is the luminosity of these stars that allow us to see them at such staggering distances. In mentioning Bootes and Arcturus, we should mention Messier-3, located in the neighboring constealltion Canes Venatici (the Hunting Dogs) and, as an added bonus, included here (please see the image and comparative table below). As part of a larger study, the author discusses this cluster in more depth here.
Our featured clusters, Messier-4 and Messier-22 are discussed at length in our introductory article. We’ll breifly describe them here for context along with a few important details.
Messier-4
Messier-4 is located within 2 degrees of the Red Giant Star Antares, the heart of Scorpio, the scorpion. A 2002 study of this cluster uncovered some of the most ancient relics in the universe, white dwarf stars that date back to between 12 and 13 billion years.
It is one of the most open of globular clusters, and follows an orbital path around the Milky Way’s Galactic Center with a period of 116 ± 3 million years. This is slightly more than 1/2 the orbital period of the sun of 225 million years. When passing through the disk, Messier-4 passes the center of our galaxy at a distances of less than 5,000 parsecs (16.3 KLy). As this occurs, it undergoes a tidal shock (a gravitational perturbation) each time, an event that can cause the repeated shedding of stars and may explain why it is one of the most open of globular clusters. It thus, may be currently much smaller than it was in the past.
Messier-22
This elliptical globular cluster is located in the constellation Sagittarius, near the Galactic bulge, is one of the brightest globulars visible and, as such, was one of the first of its kind to be discovered and later studied. As is the case with most globular clusters, its member stars are ancient relics dating back to the dawn of cosmic time, over 12 – 13 billion years.
There is strong evidence suggesting that Messier-22 contains multiple stellar populations with distinct chemical abundances, including nitrogen-enhanced stars that formed in at least two separate cycles, early on after the first generation of stars formed, suggesting a complex formation history. This idea of a complex formation history consisting of multiple stellar populations with multiple evolutionary tracks would be consistent with the strong gravitational potential of such an object whose aggregate mass could be over 100,000 solar masses and, in some cases, upwards of 500,000 (1/2 million) solar masses. This evidence of multiple evolutionary tracks from multiple stellar populations is evident in our HR Diagrams of this cluster.
Messier-3 As Exemplar and Archetypal Globular Cluster
The power of the HR Plotting tool is represented in the following table using HRD Plots of the globular star cluster Messier-3. The diagram below in the left-hand column was produced by the author using his image of Messier-3, below. The right-hand column contains a plot of the same cluster using image data obtained from the Hubble Space Telescope and other sources. In comparing the two plots, the five primary populations of stars are clearly represented in the author’s plot:
1) Main sequence (begins at about magnitude 18 and gets fainter).
2) Sub-Giant Branch (SGB) at about magnitude 18 and fainter.
3) Red Giant Branch (RGB) clearly seen extending up and to the right
4) Asyptotic Giant Branch (AGB) and Horizontal Branch (HB) stars (blue / blue-white and seen on the left side at about magnitude 16)
5) Horizontal Branch (HB) stars appear blue, on the left side of the plot at about magnitude 16
The stellar makeup of these five populations of stars are explained in depth here. To summarize, in order of occurrence:
1). Main sequence stars such as our sun are producing energy through nuclear fusion reactions in their cores. In this process, 4 hydrogen nuclei are fused together to produce one helium nucleus and energy in the form of gamma rays. This is the process that powers all stars on the Main Sequence.
2). Sub-Giant Branch stars have permanently left the main sequence after exhausting all but 12% of their compliment of core hydrogen (for 1 solar-mass stars). They begin to expand and change internally, dynamically responding to internal structural changes as the inert helium core contracts and hydrogen burning shifts to a shell surrounding the core.
3). Red Giant Branch stars have exhausted their core hydrogen, although considerable hydrogen remains in their outer layers. They produce energy through hydrogen-shell burning around an inert, gradually growing helium core. After helium ignition, the star begins core helium burning, producing carbon and oxygen. In stars with initial masses below about 8 solar masses, the resulting inert carbon–oxygen core will eventually become a carbon–oxygen white dwarf.
4). Asymptotic Giant Branch stars are highly-evolved in the 0.5 to 8 solar mass range, beyond the red giant stage and on their way to their end state as Planetary Nebulae.
5). Horizontal Branch stars are low-mass stars that have left the red giant branch after igniting helium in their cores. While hydrogen continues to burn in a surrounding shell, they produce energy through core helium burning via the Triple-Alpha Process, synthesizing carbon and oxygen from a 2-stage helium-beryllium cycle. Many horizontal branch stars appear blue and are very hot, although their temperatures and colors can vary depending largely on the mass of their outer hydrogen envelopes.
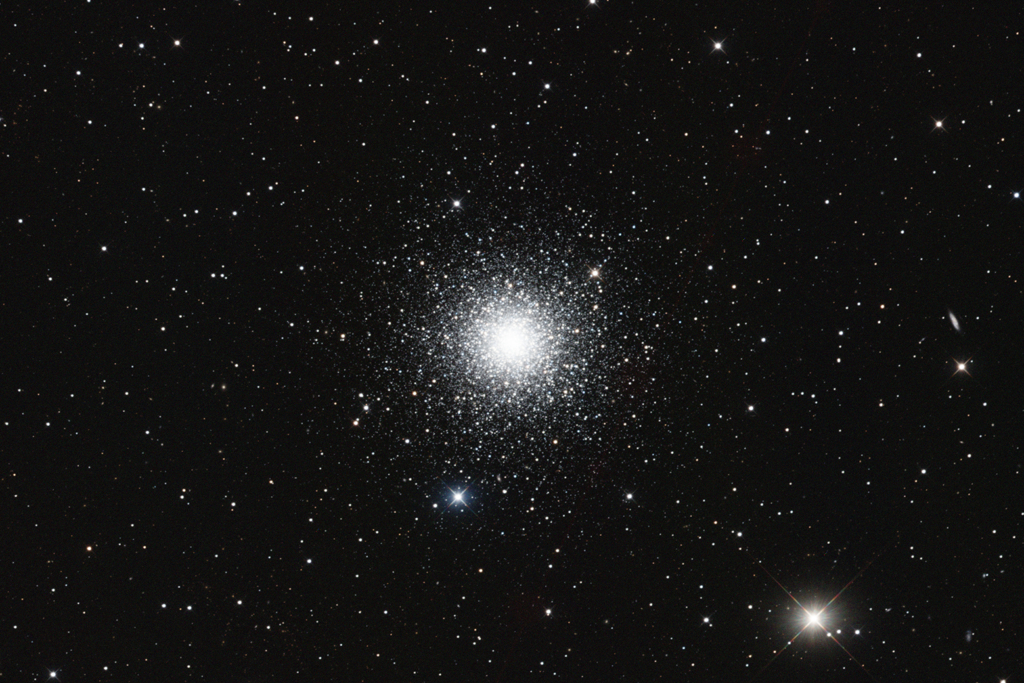
Messier-3 as imaged by the author with Insight Observatory’s 0.3 meter RC Deep Space Reflector at Pie Town, New Mexico.
| Globular Cluster M-3 plotted using the HR Plotting Tool | HR Diagram of M-3 from HST Data and other sources |
|---|---|
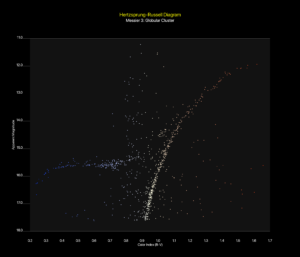 | 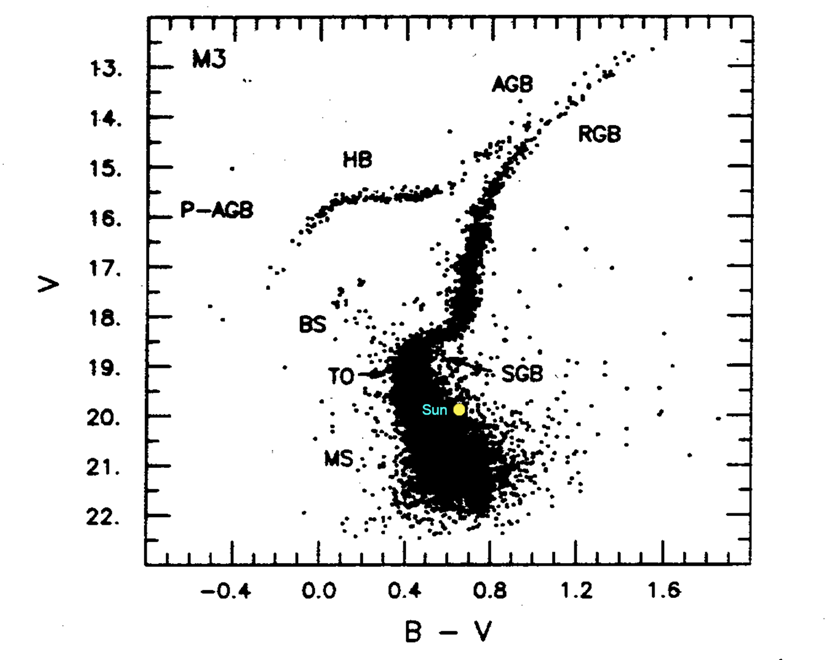 |
| The HR Diagram for Messier-3 at the cluster’s standard distance from us of 34 KLy. At this distance, our sun would shine with a feeble magnitude 20 and would not be represented. | At the distance of Messier-3, 34 KLy, the sun, represented here as a yellow disk, would be at about magnitude 20 and below the visiblity threshold of the 0.4 meter telescope used by the author for all these images. |
The Summer Sky
Compared to other seasons, the summer sky is the richest with the most dense concentration of star clusters and star forming regions, a grand collection of celestial jewel boxes. On a clear, dark, moonless night, the summer night sky is a veritable feast for the eyes, from these celestial jewel boxes to the sprawling galactic center. We present at least 3 of them here and the promise of more to come in a future installment. All the clusters mentioned in this article are famous to observers in the Northern and Southern Hemispheres and are visible now, concurrently during the same night. For more information on how to find these objects, Stellarium is a great place to start or use our interactive Tonight's Sky.
Download
Click the image of the globular cluster Messier-5 to continue
Featured Image: NGC-5139, Omega Centauri
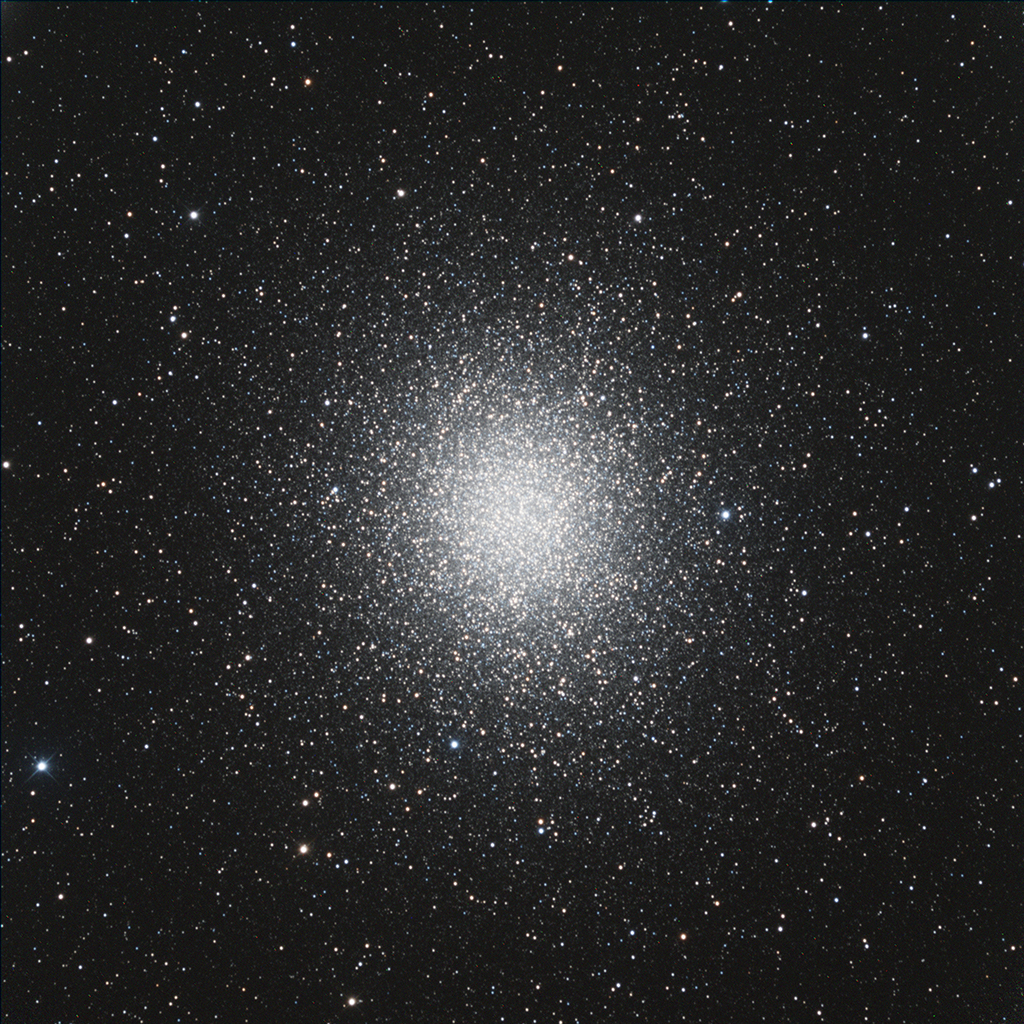
Coming soon, we will present a full featured article similar to this article for NGC-5139, an enormous agglomeration of over 4 million stars.
NGC-5139, also known as Omega Centauri, is an elliptical globular cluster similar to Messier-22 but much larger and the largest of its type in the Milky Way at a diameter of roughly 150 light-years. It is estimated to contain approximately 10 million stars with a total mass equivalent to 4 million suns. It’s so large and bright, it has the honor and distinction of being one of the “stars” in the southern constellation Centaurus, the Centaur, as “Omega”. Following the Bayer naming convention for star names and brightness, it is designated as “Omega” or the faintest (last) star in the constellation.
Astronomy for Change is an AI Free Zone

From Las Cumbres Observatory, a quick, interactive web-based view of the sky at the moment, complete with interactive controls The Sky Now. The page includes “The Sky Tonight”, a quick, interactive web-based version of Stellarium.
Astronomy For Change: https://astronomyforchange.org
Did you enjoy this article or like what we do? Why not leave a tip or buy us a Coffee?
Follow Us On Twitter: https://twitter.com/astronomychange
Why not support us on Patreon: https://www.patreon.com/astronomyforchange
Imagination is more important than knowledge

An index of all articles can be found here.
Comment Moderation Policy
If you enjoyed this article, please consider supporting us with a modest donation
or through a subscription on our Patreon Page
Membership at Astronomy for Change is Free!


One thought on “Seasonal Jewels of the Summer Sky”