This side-by-side comparative video illustrates two solar flares in 2 distinct, separate wavebands of the Extreme Ultraviolet region of the Electromagnetic Spectrum on May 27th and May 29th, 2024 respectively.
Last month, May, 2024 saw a remarkable rise in the frequency and number of strong M and X-class solar flares, an indication that internal solar activity and energy output is on the rise. Our home star is mildly variable with an 11-year cycle. The current solar cycle will peak during the summer of 2025. With over a year to go, given the frequency and number of strong M and X-Class solar flares, next year’s peak should prove to be among the strongest recorded.
Solar Flare Classification
The solar flare classification system is logarithmic (each value is 10x stronger than the previous): A, B, C, M and X with A the weakest with an associated X-ray flux less than 10-7 watts/ sq. meter (0.1 micro-watts/sq. meter) and X, the strongest, with an associated X-ray flux greater than 10-4 watts/sq. meter or 0.1 milli-watts per square meter at the earth’s distance from the sun.
The Solar Dynamics Observatory is a powerful platform from which to study the sun. All data is publicly available: SDO | Solar Dynamics Observatory (nasa.gov) with a broad spectral range to choose from, from the visible through the extreme ultraviolet.
The sequence presented in this video shows the sun in the extreme Ultra Violet part of the spectrum with a wavelength range from 9.4 nanometers through 33.5 nanometers. The composite video in the left frame shows the sun at 9.4, 19.3 and 33.5 nanometers, the right frame shows the sun at 13.1 nanometers. At these very short wavelengths at 9.4 and 13.1 nanometers, superheated 15-million degree plasma is observed as it is ejected from breaches in the Solar Photosphere. Full details about the source of these emissions can be found here: Atmospheric Imaging Assembly (lmsal.com).
X-Ray Emission
X-rays are emitted by gas at million-degree temperatures. Solar flare classifications are based on the intensity of x-rays produced by a flare at the earth’s distance from the sun. The flares in the video are X-class flares, the strongest of the classifications (see the description above for the range and how they’re determined). Each category is 10x more powerful than the previous; an X-class flare has 10x the intensity of an M-class flare and so on.
X-rays are produced by super-heated gas in the solar interior. The flare occurs when this gas is ejected in the region of a sunspot, a breach in the sun’s photosphere (the sun’s “disk”). Only gas in this temperature range can produce x-rays and since we observe these x-rays, we can infer the presence of this super-heated gas. The 9.4 and 13.1 nanometer waveband emission (left and right side of the video, respectively) in the Extreme UV region of the spectrum correspond to these temperatures (a nanometer is one billionth of a meter).
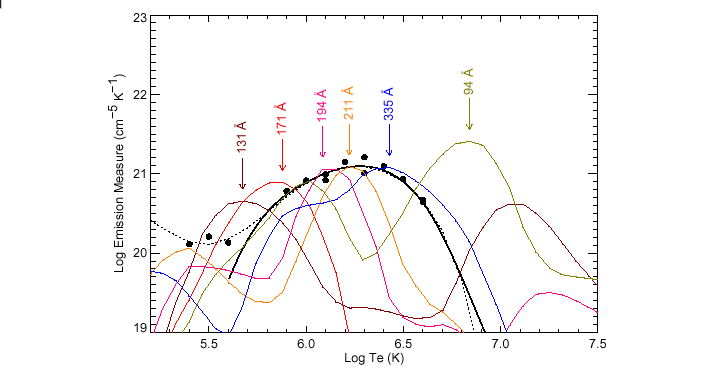
The following (log-log) chart illustrates emission vs. temperature corresponding to the filter bandpass indicated. The 9.4 nanometer filter peak corresponds to a temperature of 106.85 or 7.1 million Kelvin.

Musical score: Also Sprach Zarathustra (Royalty Free) by Strauss
Video produced using Final Cut Pro, version 10.4.7


One thought on “Spectacular Solar Flares, May 2024”