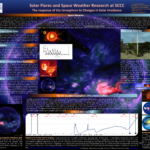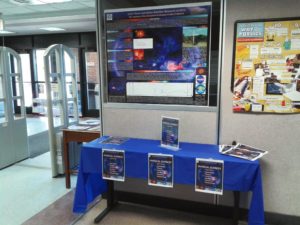
Medium resolution image of Professor Madigan’s Exhibit, highlighting and showcasing his ongoing research. Click the image to download. Other download options are available below.
Full resolution image (2624 x 2250) is available for download here 
In its support and commitment to STEM and STEM-related fields, Suffolk County Community College consistently hosts NSF-Sponsored STEM events. For two days during the Spring 2015 semester, the college hosted one such event on Wednesday and Thursday, 18 and 19 March during which students and faculty had the opportunity to exhibit and showcase their research projects at the college’s Huntington Library, located on the Ammerman campus.
Professor Thomas Madigan took this opportunity to showcase his work with Space Weather and his ongoing Solar research, highlighting just how important our understanding of the sun and its cycle is and how it affects our climate and our technology in a world that is increasingly dependent on technology. It is difficult to understate the role solar dynamics plays on the Earth’s near-space environment and that this has a direct impact on our lives. A proper understanding of it is essential in an ever-increasingly technical world and how we establish and implement national and international climate policy.
The full text of Professor Madigan’s exhibit and companion to this piece is available here
Composite video of the Sun on October 22, 2014 as recorded by the Solar Dynamics Observatory. The illuminated regions of the sun that appear in this image are over six million degrees, so hot that iron has been ionized between 11 and 17 times!
Ionospheric Dampening on October 22, 2014. Each of the flares as seen in the above video have an analog represented in this chart.

Chart illustrating ionospheric suppression from solar flares as recorded with the college’s space weather and solar flare monitoring equipment. This particular day, October 22, 2014, saw a flurry of solar flares ranging in magnitude from significant C-Class flares through M-Class flares of varying magnitudes to a severe X-Class flare of magnitude 1.6.
Professor Madigan Explaining the difference between a Solar Flare and a Coronal Mass Ejection (CME)
 Page Featured image produced by the Solar Dynamics Observatory (SDO): composite of the sun in extreme UltraViolet and soft X-Rays (respective wavelengths: 9.4 nm, 19.3 nm and 33.5 nm) on 22 October, 2014. The bright, illuminated (and “flaring” – bright red-pink) regions of the sun that appear in this image are over six million degrees, so hot that iron has been ionized between 11 and 17 times!


